< Information System Development Part 1 | Java & Friends Activities | Information System Development Part 3 >
Information System Development Process Example Part 2
2.2.3 Classes
A class is the description for a set of objects with the same attributes and operations. It serves as a template for object creation. Each object created from the template contains the attribute values that conform to attribute types defined in the class. The step in finding the classes involve analyzing the narrative text of use cases, identifying a first-guess set of objects that will participate in those use cases and classifying these objects based on the following stereotypes:
Boundary objects are the objects with which the actors (for instance, the users) will be interacting in the new system. These frequently include windows, screens, dialogs and menus. Entity objects often map to the database tables and files that contain the information that needs to "outlive" use case execution. Other than persistent, some of your entity objects are transient objects, such as search results, that "die" when the use case ends. Control objects (controllers) embody much of the application logic and serve as the connecting element between the users and the stored data. This is where you capture frequently changing business rules and policies, and localize changes to these objects without disrupting your user interface or your database schema down the line. Examples of control classes include transaction managers, resource coordinators and error handlers. We do this by walking through the use case text, one sentence at a time, and drawing the actors, the appropriate boundary, entity objects and controllers, and the connections among the various elements of the diagram. However, four basic rules must be obeyed for this process: |
-
Actors can only talk to boundary objects.
-
Boundary objects can only talk to controllers and actors.
-
Entity objects can only talk to controllers.
-
Controllers can talk to boundary objects and entity objects, and to other controllers, but not to actors.
Those rules can be summarized in the following Figure.

Figure 2.6: Rules in building the sequence diagram
Keep in mind that both boundary objects and entity objects are nouns, and that controllers are verbs. We may need to rewrite our use case text many times to remove ambiguity and to explicitly reference boundary objects and entity objects. There is no perfect use case text in the first draft and the process must be done iteratively.
2.2.3.1 Three compartments
The found classes are documented in the Class diagram as three compartments as shown in the following Figure. The top compartment holds the class name and the stereotype name may also be included. The middle compartment declares all attributes for the class. The bottom compartment contains definitions of operations.
|
|
|
Figure 2.7: Class’s three compartments
An attribute is the type-value pair. Classes define attribute types whereas objects contain attribute values. An operation (or the method, to be precise) is invoked by a message sent to it. The name of the message and the name of the operation are the same.
Next, after finding the classes, to accomplish a task many objects may need to collaborate. Objects collaborate by invoking operations in other objects. Collaboration may be in form of association, aggregation and generalization. The following section list down all the found classes in our project. It is our first attempt and no collaboration shown here. We have nine classes:
-
Activity data entry page – boundary.
-
Participant data entry page – boundary.
-
Report generator main page – boundary.
-
System main page – boundary.
-
Report manager – controller.
-
CeC activity – entity.
-
Participant data – entity.
-
Report – entity.
-
CeC Users – entity.
The following are the class diagrams that have been drawn using the Rational Rose.
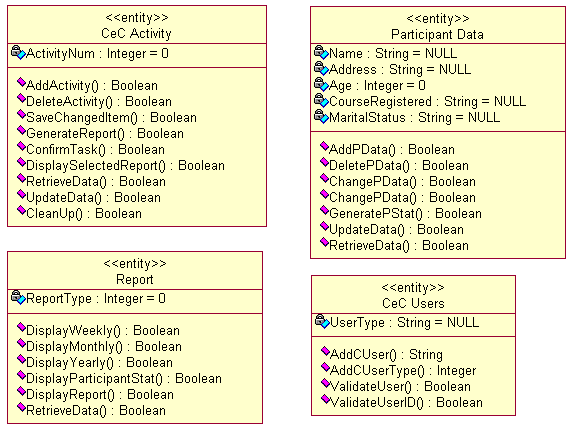
Figure 2.8: Boundary classes
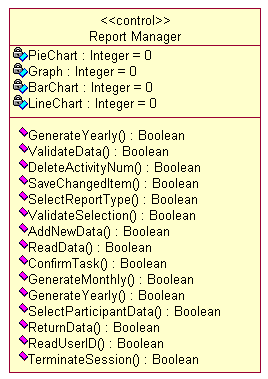
Figure 2.9: Controller class
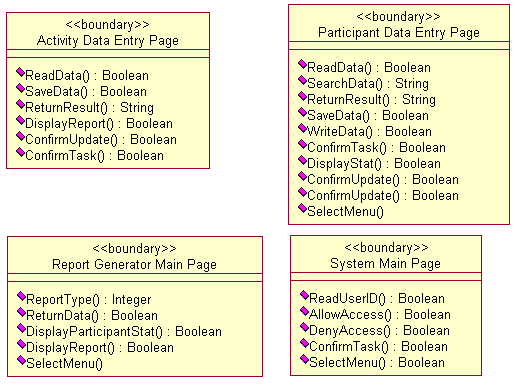
Figure 2.10: Entity classes
2.2.4 Sequence Diagrams
Interaction modeling captures interactions between objects that need to be performed to satisfy a use case. This type of modeling occurs once the class diagram has stabilized. Interaction modeling is similar to activity modeling but at a lower level of abstraction. Activity modeling shows the sequencing of events without assigning those events to objects whereas the Interaction modeling shows the sequencing of events (messages) between collaborating objects. There are two types of the Interaction Diagrams:
-
Sequence Diagram - focus is on events over time and normally used in analysis stage.
-
Collaboration Diagram - focus is on object relationships and normally used in design stage.
An interaction is a set of messages (that define behavior) exchanged between objects over links. A sequence diagram represents an interaction with a two-dimensional graph with:
-
Objects arrayed across the top of the diagram.
-
Each vertical line is the object's lifeline.
-
Event or message sequences shown from top to bottom.
-
An arrow represents a message from a calling object (sender) to an operation (method) in the called object (target). Actual argument can be:
Input argument (from the sender to the target).
Output argument (from the target back to the sender).
-
Events occur between object lifelines as a message from a sender to an operation in the target (actual parameters can be specified here).
-
Showing the return of control from the target to the sender is not necessary.
Showing the return of control from the target to the calling object is not necessary however, it is sometimes done to show return values (dashed arrow). If a message needs to be sent to a collection of objects, the message name is prefixed with an asterisk or the iteration marker that means the indicated message is sent to each object in the collection.
Sequence diagrams normally developed from activity diagram. Activity diagrams model the details of use cases; these details help discover classes. Sequence diagrams further elaborate the details of activity diagrams; these new details help to discover class operations. The Interaction modeling can be incremental that means you may only need to construct a few sequence diagrams at first; return later to construct more. In our case we start constructing the sequence diagram from the class diagram and use case diagram. Every use case in the use case diagram will be converted to the sequence diagram. The following are the sequence diagrams from our first attempt. After eliminating the duplicated diagrams, we have a total thirteen (13) sequence diagrams as listed below.
-
Add Activity
-
Delete Activity
-
Save Changed Item
-
Generate Report
-
Add Participant Data
-
Delete Participant Data
-
Change Participant Data
-
Save Changed Data
-
Generate Participant Statistical Information
-
Produce CeC Report
-
Produce Statistical Information
-
Login System
-
Logoff System

Figure 2.11: Add Activity sequence diagram

Figure 2.12: Delete Activity sequence diagram
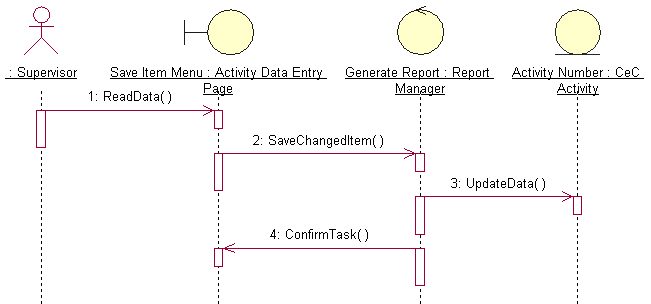
Figure 2.13: Save Changed Item sequence diagram
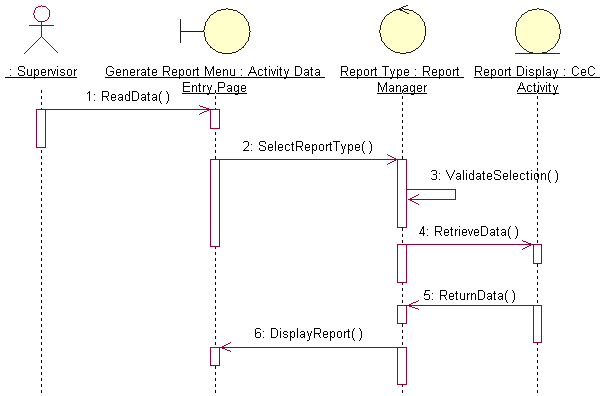
Figure 2.14: Generate Report sequence diagram

Figure 2.15: Add Participant Data sequence diagram
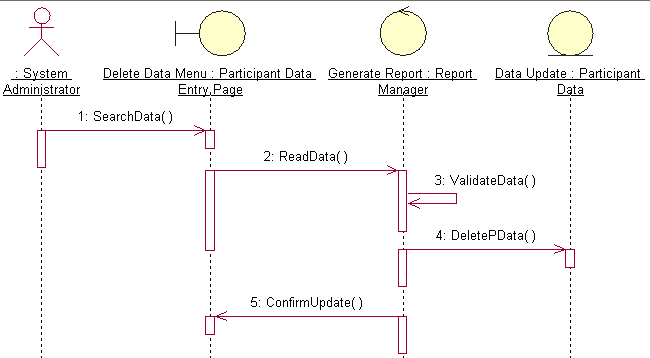
Figure 2.16: Delete Participant Data sequence diagram
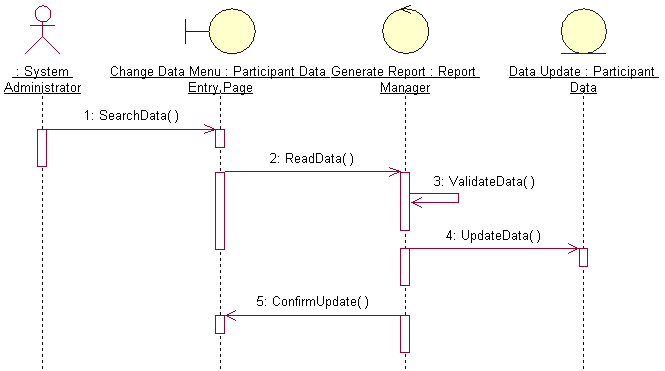
Figure 2.17: Change Participant Data sequence diagram

Figure 2.18: Save Changed Data sequence diagram

Figure 2.19: Generate Participant Statistical Information sequence diagram
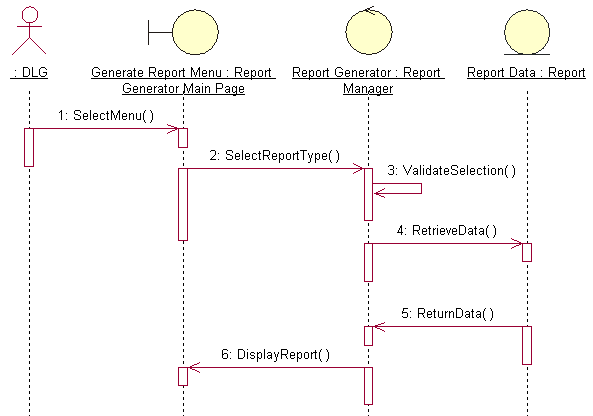
Figure 2.20: Produce CeC Report sequence diagram
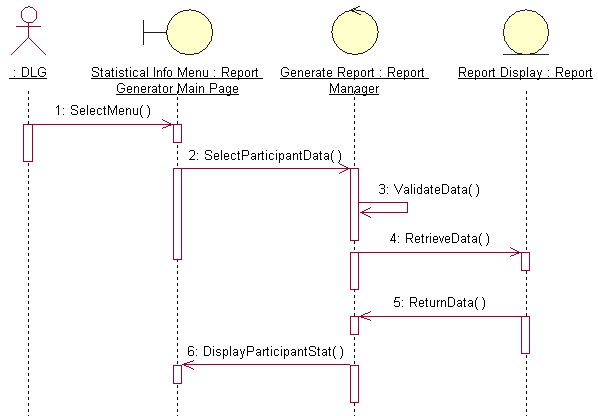
Figure 2.21: Produce Statistical Information sequence diagram
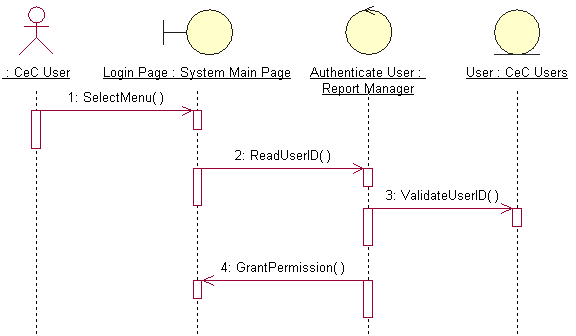
Figure 2.22: Login System sequence diagram

Figure 2.23: Logoff System sequence diagram